Homework 5: k-D Trees and Range Trees
Part 1: Book Problems
Prepare a PDF file named hw5_kdtrees_and_range_trees.pdf with your
answers to the book problems below. You may use Latex, Google Docs
(export/save as PDF), MS Word (export/save as PDF),
and/or legibly handwrite on paper and scan to PDF.
From
"Computational Geometry: Algorithms and Applications", de Berg, Cheong, van Kreveld, and Overmars.
You may discuss these problems with your classmates, but you must
write up your solutions individually. Note the names of anyone you
talked to or collaborated with in your hw5_kdtrees_and_range_trees.pdf writeup.
Please do not search for solutions or notes published by the
authors or any instructor or notes or solutions shared by other
students on the internet. Any use of these types of materials is
considered a violation of Academic Integrity for this course.
5.6
Describe algorithms to insert and delete points from a range tree. You
don't have to take care of rebalancing the structure.
5.8a,b
Theorem 5.8 showed that a range tree on a set
of n points in the plane requires O(n
log n) storage. One could bring down the storage requirements
by storing associated structures only with a subset of the nodes in
the main tree.
a. Suppose that only the nodes with depth 0, 2, 4, 6, ... have
an associated structure. Show how the query algorithm can be adapted
to answer queries correctly.
b.Analyze the storage requirements and query time of such a
data structure.
5.10a,b
In some applications one is interested only in the number of points that
lie in a range rather than in reporting all of them. Such queries are often
referred to as range counting queries. In this case one would like to avoid
having an additive term of O(k) in the query time.
a. Describe how a 1-dimensional range tree can be adapted such
that a range counting query can be performed in O(log n)
time. Prove the query time bound.
b. Using the solution to the 1-dimensional problem, describe
how d-dimensional range counting queries can be answered in
O(logd n) time. Prove the query time.
Part 2: CGAL Programming Task
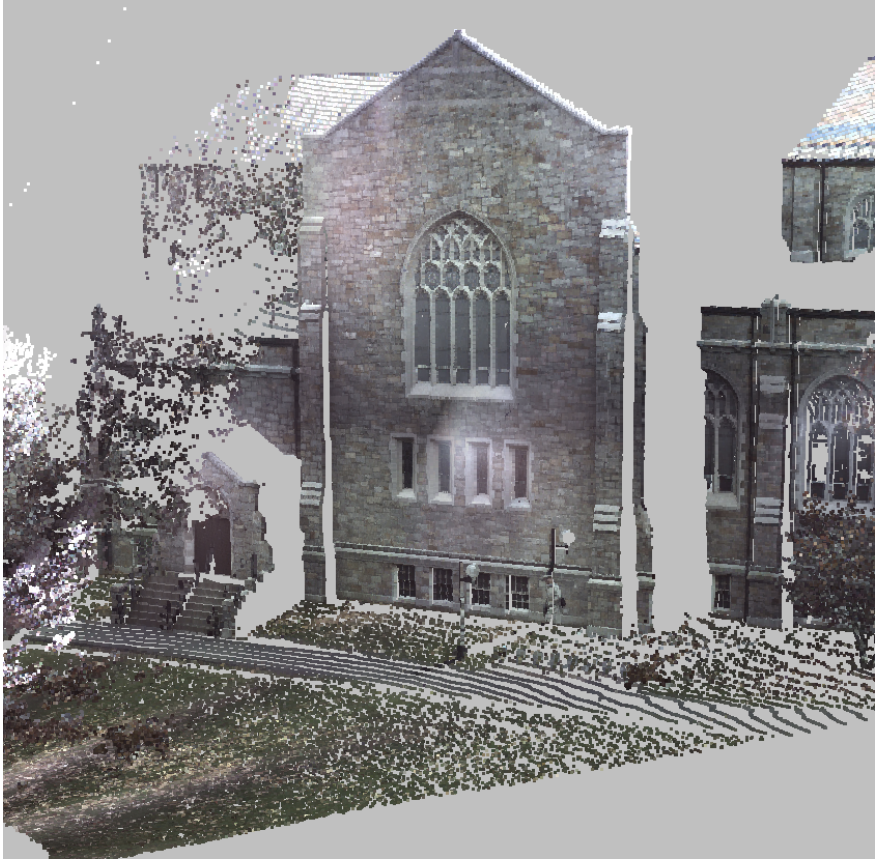
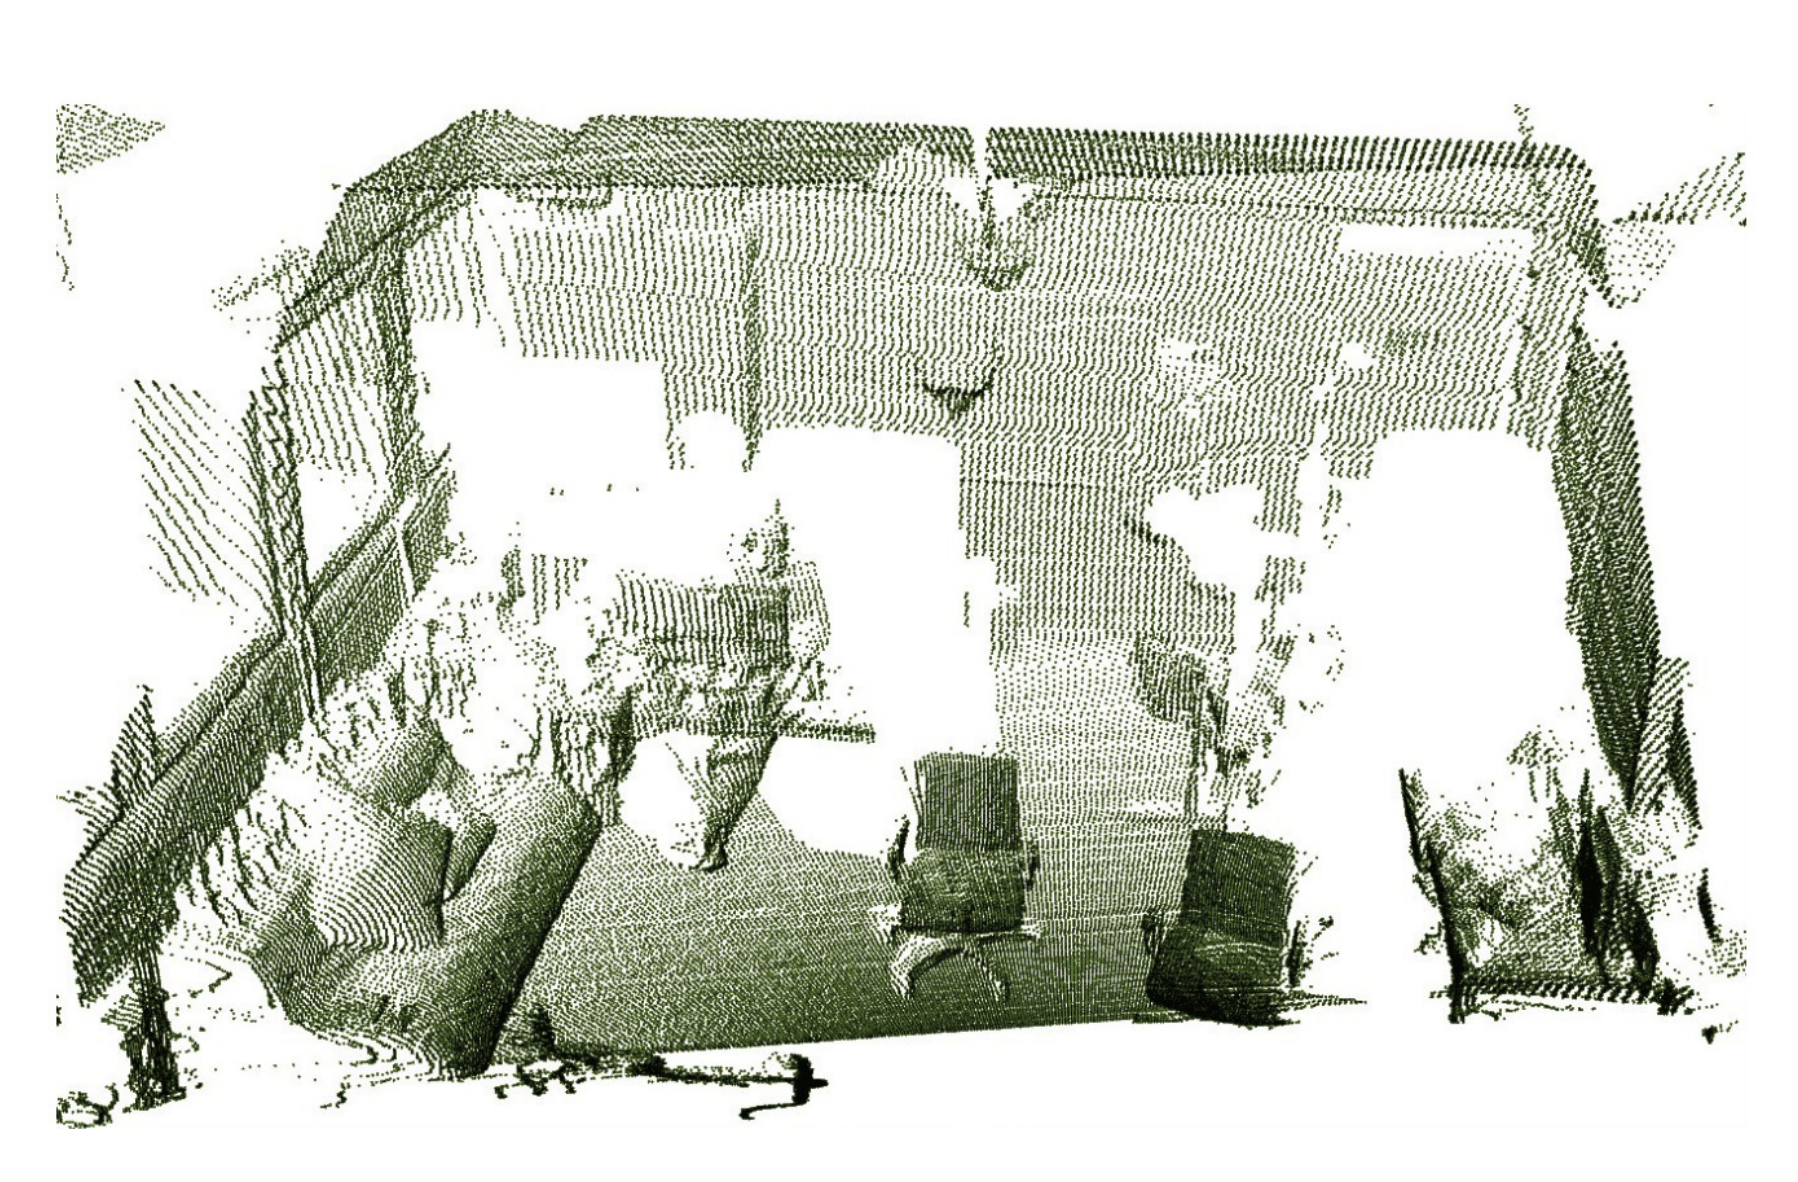
Lidar or "light detection and ranging" technology is used to collect
3D points, a.k.a., a point cloud, of objects in the world around us.
It can be used to scan the exteriors or interiors of buildings, as
shown in the examples below. Note that the scan points have some
uncertainty or noise in the point position and we have holes or
missing data when objects are occluded or shadowed by other parts of
the scene.
-
Left image from:
B.J. King, T. Malisiewicz, C.V. Stewart, R.J. Radke, "Registration of
Multiple Range Scans as a Location Recognition Problem: Hypothesis
Generation, Refinement and Verification", Proceedings of the Fifth
International Conference on 3-D Digital Imaging and Modeling,
pp.180-187, Ottawa, Ontario, Canada, June 13-16, 2005.
-
Right image from:
"3D is here: Point Cloud Library (PCL)",
Radu Bogdan Rusu and Steve Cousins,
Robotics and Automation (ICRA), 2011.
A common task is to collect all points near a query
point x,y,z and estimate the local surface geometry,
specifically the surface normal. This is helpful in eventually
accomplishing the ultimate goal of converting the point cloud to a
polygonal surface mesh.
Your task is to write a program that loads a point cloud, a large set
of 3D points, from an input file and stores them in a CGAL kD tree.
You will then process a list of queries against the kD tree one at a
time. For each of these query points you will collect the c
data points closest to that query position and give a rough estimate
of the surface geometry at that position. We will assume that the
surface is axis-aligned -- that is, it is parallel to the xy, yz, or
xz plane.
For each query point you will output the best match plane (xy, yz, or
xz), and the minimum radius necessary to capture exactly c
points within a circle of that radius in the specified plane, with a
tolerance or error in the perpendicular axis of no more than plus or
minus t units. The values of c and t will
be provided on the command line.
For example, we will start with a point cloud of 10,000 randomly
distributed points on the surface of a cube from
(-10,-10,-10)->(10,10,10). We are given 6 query points, one near the
middle of each of the 6 faces of the cube. Once we determine the best
matching axis-aligned plane, we determine the tightest radius around
that query point that captures c=100 points with
tolerance +/- 0.01 distance from that plane.
./detect_point_cloud_surface input_cube_points.txt input_cube_queries.txt 100 0.01 output_cube_stats.txt
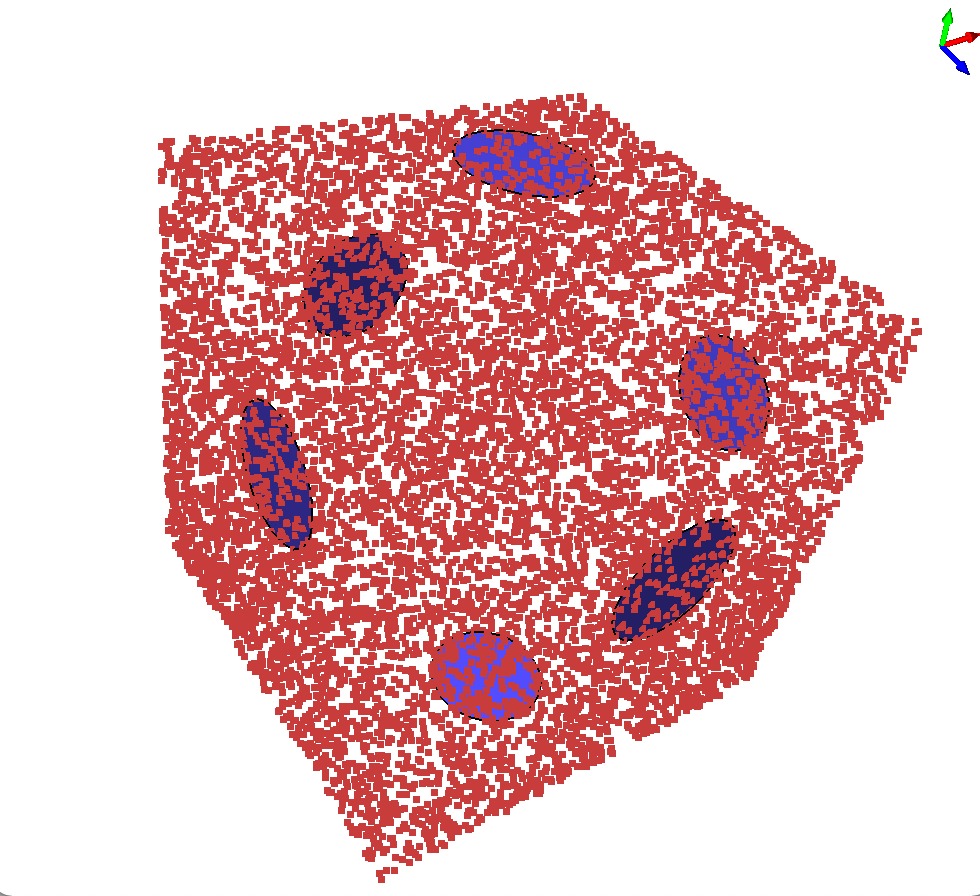
After outputting the statistics file above, your program can use the
CGAL Surface Mesh visualization to draw both the input point cloud
data AND simple polygonal representation of the circles, as shown
below. Note that pressing 'v' will draw the vertices.
Additional test data:
Be sure to try different values for c, the target number of
points to capture and the tolerance t.
Part 3: Analysis of Implementation
In your hw5_kdtrees_and_range_trees.pdf file, analyze the running
time of your implementation for Part 2, in terms of
n, the number of points in the point cloud, and c
the number of points that must be collected. You may introduce other
variables as necessary.